Principles of recording from the brain using EEG

Table of Contents
Introduction #
EEG was something I didn’t get much hands-on exposure to during my undergrad, with the exception of taking part in a visual attention study. However I’ve been interested in it recently, particularly for the integrated brain-computer interface (BCI) applications. When I can buy an OpenBCI board I will definitely be running my own experiments at home. This post is a write-up of some of my notes about the biological basis of EEG, some common artifacts seen in the signal, and the inverse problem.
Measuring electrical activity from the brain #
The core of EEG recording is to measure electrical activity from the brain that is detectable from the scalp. To do this, you place a number of surface electrodes (the more you use, the higher the resolution) in contact with the scalp. A high resolution system might have as many as 256 electrodes [1]. A soft cap or hard shell is used to keep the electrodes in place with constant pressure, and conductive gel is applied to the skin underneath.
Why use EEG to investigate cognitive processes? One excellent reason is the relatively low cost of equipment. At the lower price ranges ( look here for a comparison), you can get the full set of kit for approximately £80-£1000. The cheaper options have only one channel whilst the more luxury sets go up to 16. EEG is also non-invasive, which helps if you don’t have a lab and willing test subject just lying around. These considerations have opened the doors to exciting BCI companies such as Neurable, who are building a VR game controlled by EEG.
So what actually is the EEG signal? #
The EEG signal is a recording of the summed dendritic field potentials of groups of neurons varying together in time. The dendritic trees of large pyramidal cortical neurons are oriented perpendicularly to the surface of the scalp [1]. When the dendrites near the cell body are excited, the voltage across the membrane of the trees is depolarized by the synaptic activity. This makes the voltage less negative or even positive.
This causes a voltage gradient; where there is a current flowing along the length of the dendrite and also a conduction of the return current through the tissue volume outside the dendrite. The purpose of the electrodes is to record the fluctuation in voltages caused by this return current.
Frequency bands #
The EEG signal can be further seperated according to the power in each frequency band [1]. These are:
| Name | Frequency Band | Observations |
|---|---|---|
| Delta | 0.5-4Hz | Highest amplitude, slowest waves. Seen in deep stage 3 of NREM/slow wave sleep [3] |
| Theta | 4-8Hz | “Slow” activity. Encoding temporary episodic memory into long term episodic memory [4] |
| Alpha | 8-12Hz | AKA Bergers wave, seen mainly on the posterior regions. Assoc. with wakeful state, sensory processing and inhibition of planned actions [1, 5] |
| Beta | 12-25Hz | “Fast” activity, generally regarded as a normal rhythm [6] |
| Gamma | 25-70Hz | Seen from large scale brain network activity and general phenomena like attention and working memory [6] |
| High Gamma | 70-150Hz | High freq. band, associated with cognitive control of emotions [7] |
What kind of artifacts can you see in EEG? #
Some artifacts that are found in the EEG signal include:
- Eye blink. When I was doing the visual attention study I was told to blink as little as possible over the course of the experiment, which was surprisingly difficult. Why does this occur? In the signal, the eye blink is a sharp spike from the frontal electrodes (near the eye) and is called the EOG (electrooculogram) signal. It has a amplitude around an order of magnitude larger than the rest of the EEG signal [
8]. - Other muscle activity. This includes face and body movements like fidgeting or clenching the jaw, tension and respiration.
- Physiological processes. If sweat gets on the electrodes, this can change their electrical baseline. In terms of frequency this can make a low frequency artifact on the theta and delta bands [
8].
This post at Bitbrain does a great job at covering more of the artifacts 🧠⚡
EEG v.s ERP #
EEG is the ongoing, continuous signal measured from the scalp electrodes. An event-related potential (ERP) on the other hand, is a time-locked voltage fluctuation of this signal in response to an external/internal stimulus. The portion of the signal after the event called an epoch, where we will call the \(k\) th epoch \(S_{k}\) (epoch really isn’t a helpful term for those who study deep learning). So if a visual stimulus occured at \(t=0\) and the epoch length elength was 350ms, the period from \(t\) to \(t+e_{length}\) is the epoch lasting 350ms. Because we need to reduce background noise and amplify the signal of this small component, the ERP is the average of all the epochs.
$$ \frac 1 n \sum_{k=1}^{n} S_{k} $$
where there are \(n\) presentations of the stimulus. The reason why ERPs are analysed rather than the ongoing EEG signal is because this signal can be correlated with cognitive events. ERPs have a very high temporal resolution, and so are particularly useful for experiments with a sequential or timing component [1].
How do you place the electrodes? #
The convention for placing the electrodes follows the International 10-10 or 10-20 system. In this system:
- Letters: Correspond to the position on the scalp
- F - Frontal
- Fp - Pre-frontal
- C - Central
- P - Parietal
- O - Occipital
- T - Temporal
- Numbers: The position with respect to the midline
- Odd numbers on the left (1, 3, 5, 7, 9)
- Even numbers on the right (2, 4, 6, 8, 10)
- z indicates placement on the midline sagittal plane. These are usually reference/ground points.
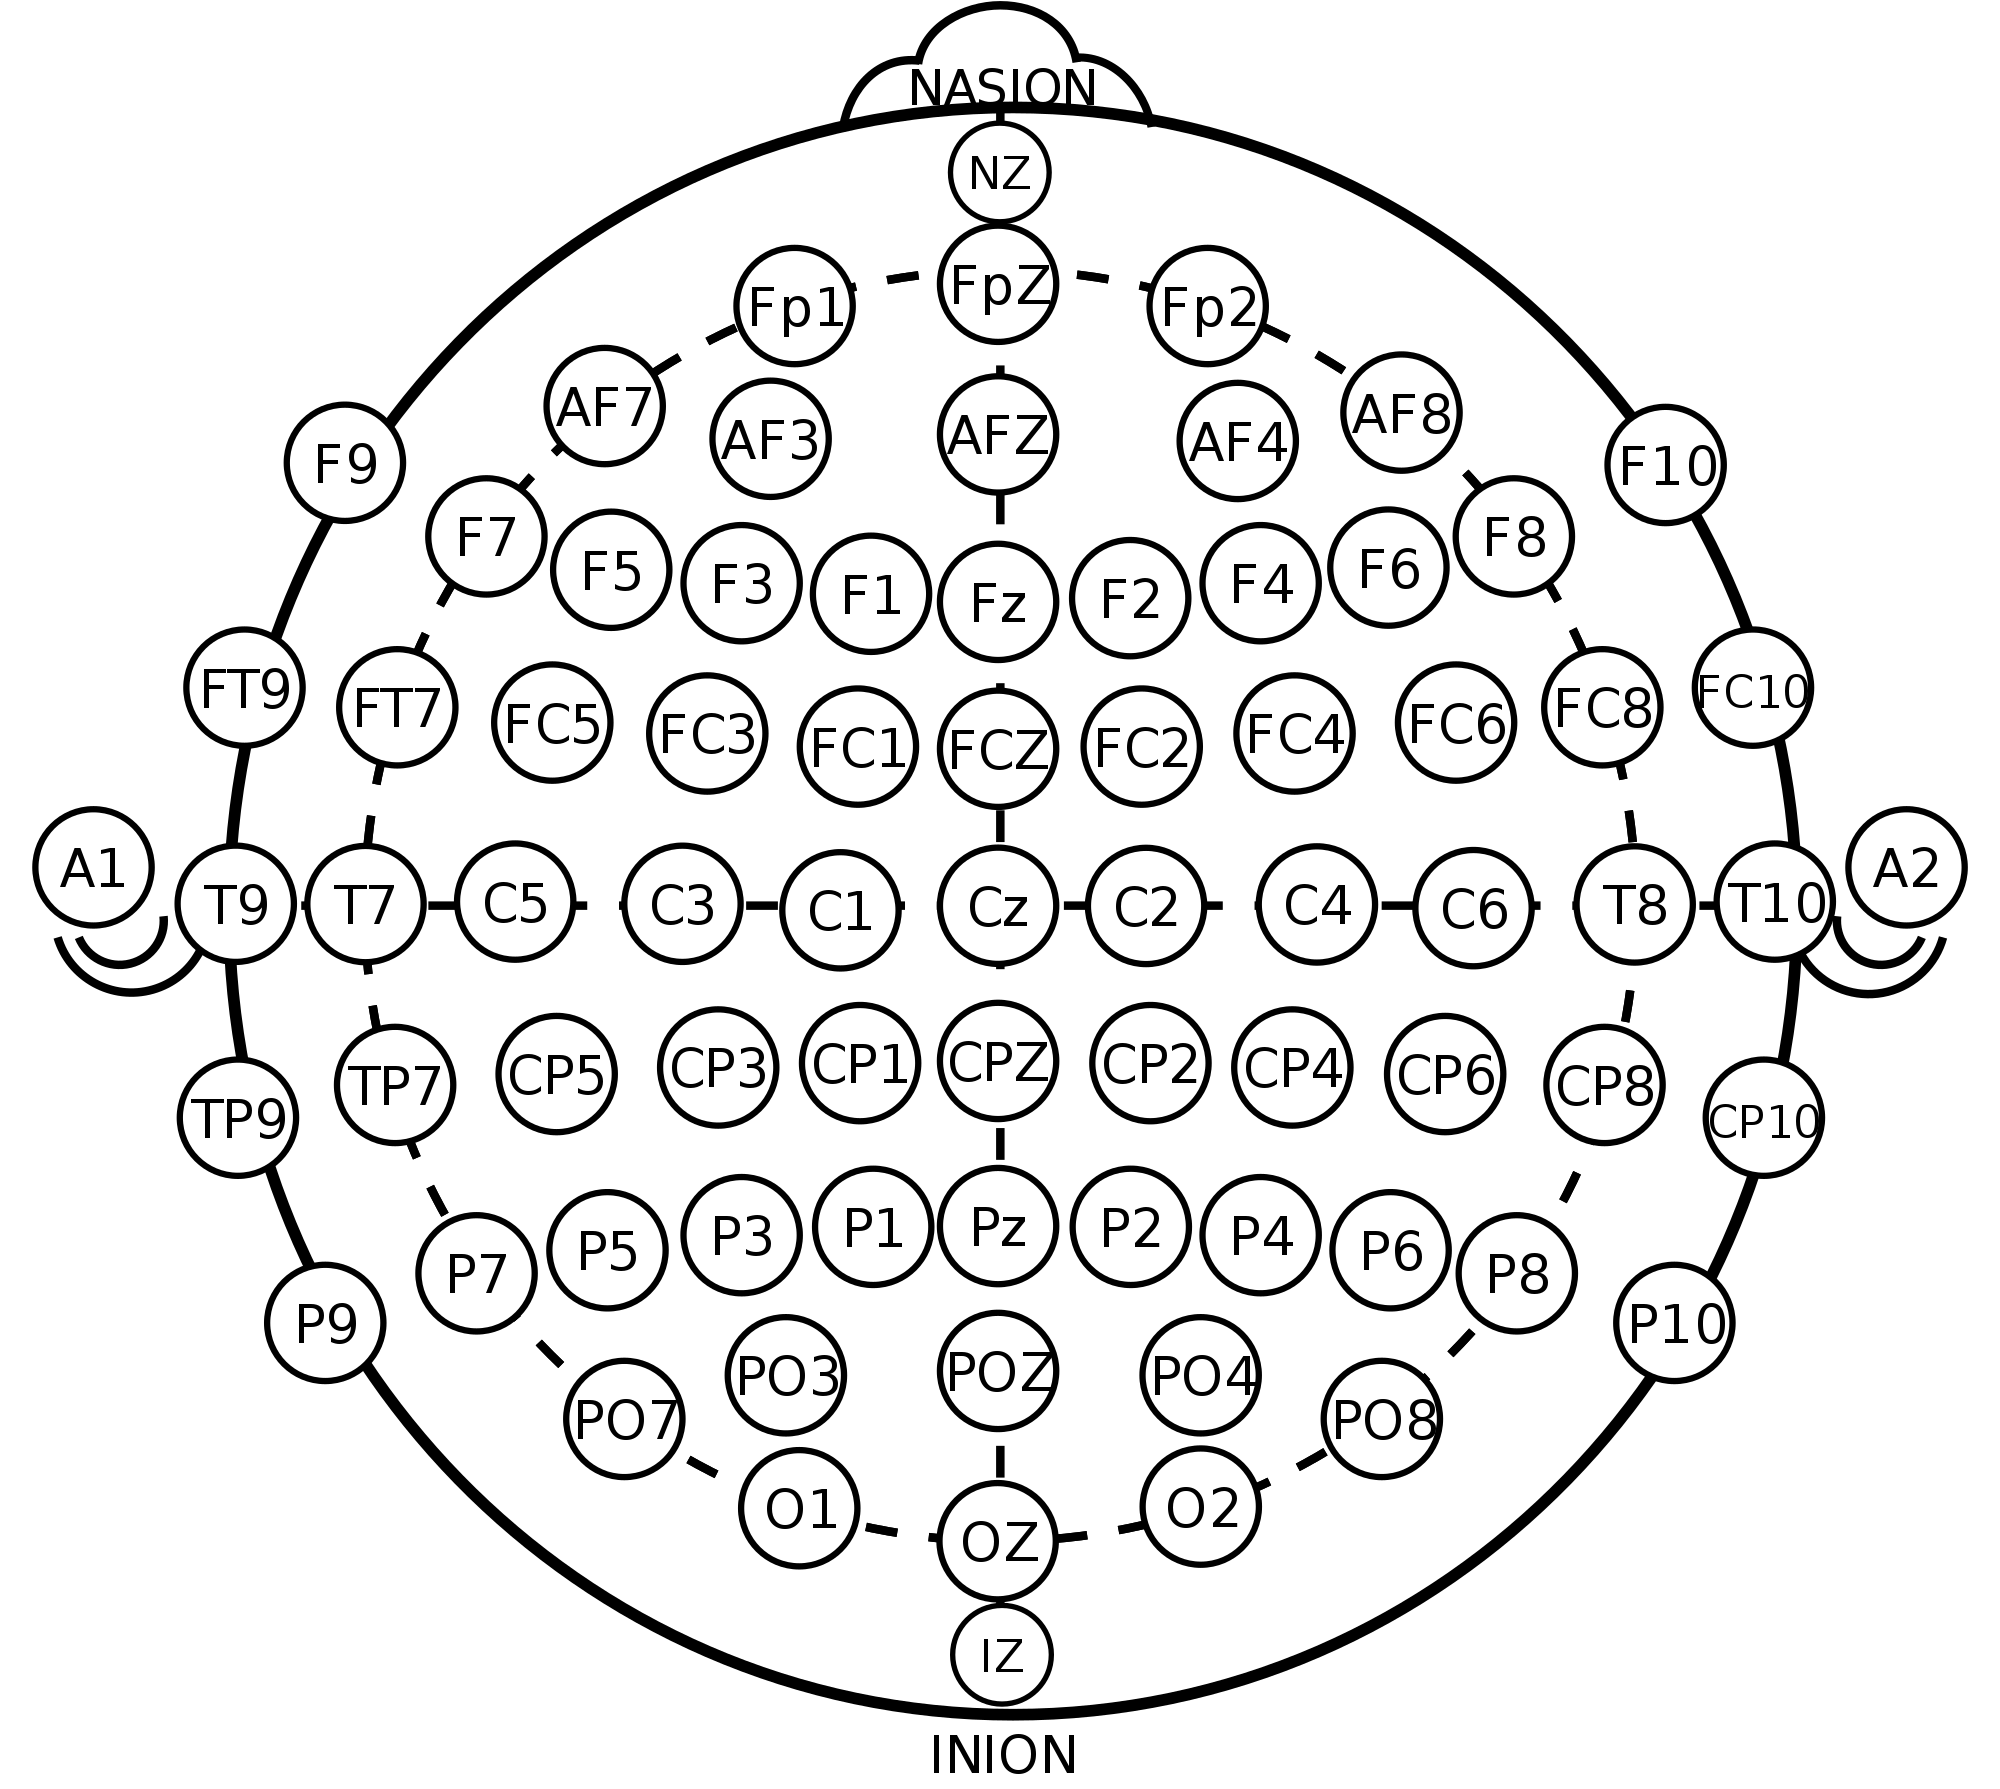
When you are using a higher resolution system (more electrodes), the additional sites are added inbetween using the 10% division. This then uses the Modified Combinatorial Nomenclature system for naming. A combination of letters indicates which units the electrode is inbetween. For example FC1 is the first electrode on the left hemisphere, inbetween the frontal and central regions. There is also a reference electrode placed somewhere else on the scalp, such as the left mastoid.
A note on the inverse problem #
The inverse problem in the context of EEG means that we start with the signal, and from this we have to infer the location on the cortical surface and/or cognitive or physical process that caused it. This means the problem is ill posed, as there is no unique solution to finding these parameters. The earlier description of the orientation of the neurons is one assumption that is made to constrain the solution space to the cortical surface [9].
I went to a lecture from the University of Bristol last week about pinpointing the location of a ground spectral event recorded from a UAV when it is flying high above the ground. As the drone gets higher in the air, the resolution it can record decreases. However the signal can be reconstructed algorithmically at a finer resolution. This means that the drone can fly higher (at a safer distance) without compromising the quality of the recordings. To relate this to the inverse problem in EEG, I wonder if there are techniques that have been applied to pinpoint the electrical origins.
Okay, where can I find some EEG data to play with? #
There have been multiple machine learning competitions based around feature extraction from time-varying components. For example the Grasp-and-Lift EEG Detection competition on Kaggle looked at identifying states of the hand (grasping, lifting, replacing) from the EEG signal. There was also the intracranial EEG competition for seizure prediction. Here is a collection of links to EEG datasets on the blog Engineuring.
Conclusion #
This post has covered some brief principles about the EEG signal. Of course the topic is much deeper than has been explained here, but this was just a general overview. In the future I may do a deep dive post into one specific area. I’ve covered the main biological assumptions of how the signal is generated and some common signal artifacts, the locations of the electrodes on the scalp, what the inverse problem is and where you can find some open-source datasets.
Thanks for reading!
References #
- Purves, D., Cabeza, R., Huettel, S. A., LaBar, K. S., Platt, M. L., Woldorff, M. G., & Brannon, E. M. (2008). Cognitive neuroscience. Sunderland: Sinauer Associates, Inc.
- Strobbe, Gregor. (2015). Advanced forward models for EEG source imaging.
- Abhang, P. A., Gawali, B. W., & Mehrotra, S. C. (2016). Technical aspects of brain rhythms and speech parameters. Introduction to EEG-and Speech-Based Emotion Recognition, 51-79.
- Peigneux, P., & Smith, C. (2010). Memory processing in relation to sleep. Principles and practice of sleep medicine, 5.
- Baars, B., & Gage, N. M. (2013). Fundamentals of cognitive neuroscience: a beginner’s guide. Academic Press.
- Abhang, P. A., Gawali, B. W., & Mehrotra, S. C. (2016). Introduction to EEG-and speech-based emotion recognition. Academic Press.
- Yang, K., Tong, L., Shu, J., Zhuang, N., Yan, B., & Zeng, Y. (2020). High Gamma Band EEG Closely Related to Emotion: Evidence From Functional Network. Frontiers in Human Neuroscience, 14.
- BitBrain - EEG Artifacts
- The Inverse Problem in EEG – Assumptions and Pitfalls - Sapien Labs